RANDOM INTERPOLATION
Lower Dimensionality
(Comparison with Other Interpolaton Methods)
Two testing sample functions have the following analytic forms:f(x1, x2) = 41.64 + 1.22 x12 + 0.76 x22 + 8.33 x1 + 10.8 x2 + 0.64 x1x2 ; [Eq. A]
 [Eq. B]
where -10. < x1 < +10. and -10. < x2 < +10.
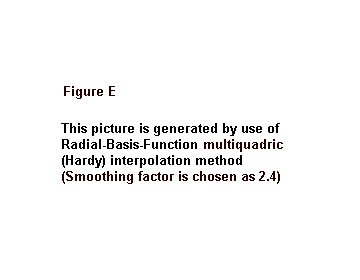
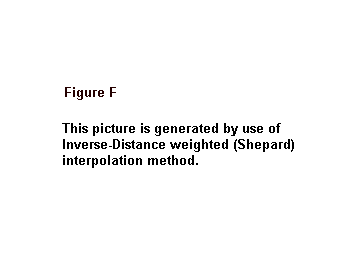
We present results of other standard Interpolation Methods for the same testing functions as given above. Two most widely used interpolation methods, inverse-distance-weighted-to-a-power-of-two(Shepard's method) and radial-basis-function (Hardy's multiquadraic method), have been used to do the same interpolation with the same 12 random input locations. For the 12 randomly chosen input locations, click and see the picture.
Three quality factors (performance measures) are selected for the comparison. They are:- Reproduced function value at every input location
- Cross-Validation (the so-called Leave-One-Out scheme) function value at every input location
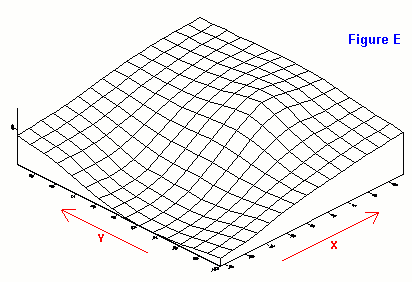
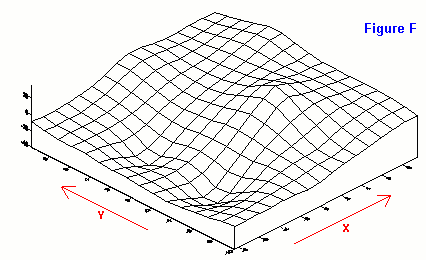
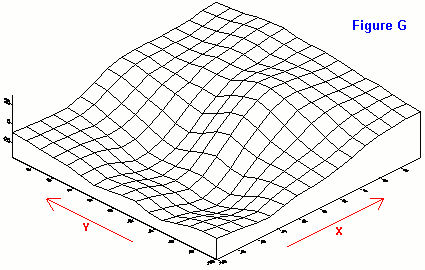
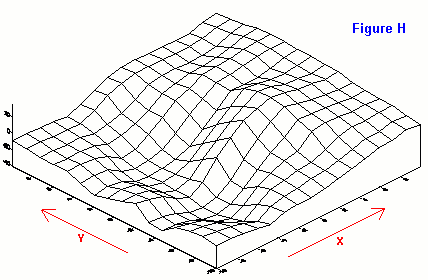
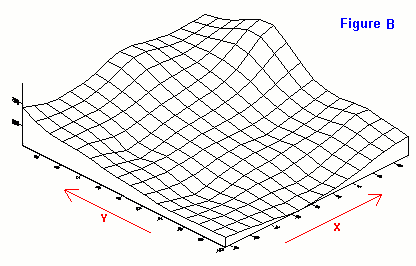
- Smoothness of the interpolated function (Shown with wire-frame pictures)
We first present the comparison results for the function defined by [Eq. A]. Table A and Table B are for Quality Factor 1 and 2 respectively.
| Quality Factor 1: Reproduced Function
It should be pointed out that Shepard's method and Hardy's method are both "exact"interpolators.
That is, they can reproduce the exact function values at input locations. This is also true for our Dirac-Monte-Carlo method when delta width is much smaller than 1 and approaching zero. In practice, the delta width, which depends on the domain interval length and the the number of sample locations, is set at a small but a finite value. Reproduced function values are tabulated below for two different delta width values. As can be seen, they all agree well with the original input data.
Table A
Location
Number | Input x1 | Input x2 | Input f(x1, x2) | Reproduced Function
f(x1, x2)
( 1= 1= 2=1) 2=1) | Reproduced Function
f(x1, x2)
( 1= 1= 2=2) 2=2) |
|---|
| 1 | 1.6 | 9.0 | 226.06 | 224.17 | 213.56 |
| 2 | 5.6 | -4.2 | 79.54 | 79.53 | 81.23 |
| 3 | -1.0 | -10. | 8.93 | 9.31 | 12.54 |
| 4 | -4.6 | -4.0 | 9.87 | 12.12 | 20.94 |
| 5 | 3.6 | -2.4 | 60.36 | 61.34 | 66.04 |
| 6 | -7.4 | 6.6 | 119.93 | 125.44 | 129.08 |
| 7 | 1.6 | -8.2 | 12.23 | 13.7 | 21.03 |
| 8 | -4.6 | 2.4 | 52.36 | 52.77 | 60.97 |
| 9 | -8.4 | 9.8 | 183.89 | 178.25 | 163.64 |
| 10 | 9.4 | 3.8 | 302.61 | 300.45 | 286.18 |
| 11 | 8.6 | -5.8 | 134.51 | 133.29 | 124.47 |
| 12 | -7.4 | 7.2 | 129.86 | 127.65 | 131.84 |
|
| Quality Factor 2: Cross-Validation
Table B
Location
Number | Input f(x1, x2) | Cross-Validation
f(x1, x2)
( 1= 1= 2=1) 2=1) | Cross-Validation
f(x1, x2)
( 1= 1= 2=2) 2=2) | Cross-Validation
f(x1, x2)
(Shepard's method) | Cross-Validation
f(x1, x2)
(Hardy's method) |
|---|
| 1 | 226.06 | 117.64 | 120.78 | 122.41 | 217.24 |
| 2 | 79.54 | 79.49 | 84.2 | 87.29 | 85.39 |
| 3 | 8.93 | 20.18 | 25.94 | 43.07 | 1.91 |
| 4 | 9.87 | 63.24 | 66.0 | 75.64 | 9.94 |
| 5 | 60.36 | 76.76 | 78.77 | 88.99 | 79.12 |
| 6 | 119.93 | 132.43 | 136.43 | 130.26 | 118.09 |
| 7 | 12.23 | 44.62 | 45.02 | 52.58 | 24.31 |
| 8 | 52.36 | 63.24 | 94.2 | 110.83 | 78.57 |
| 9 | 183.89 | 129 | 128.62 | 122.05 | 154.8 |
| 10 | 302.61 | 114. | 109. | 101.03 | 185.72 |
| 11 | 134.51 | 104.82 | 92.46 | 82.21 | 116.45 |
| 12 | 129.86 | 124.92 | 133.36 | 121.96 | 132.31 |
|
Quality Factor 3: Smoothness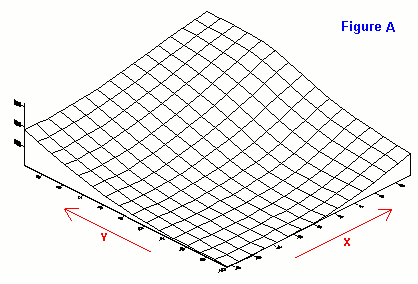  |
  |
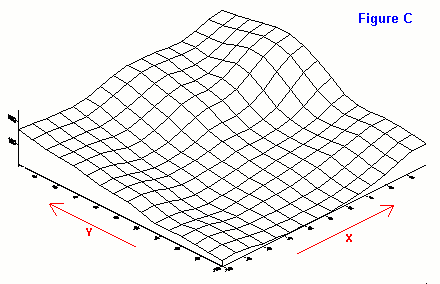  |
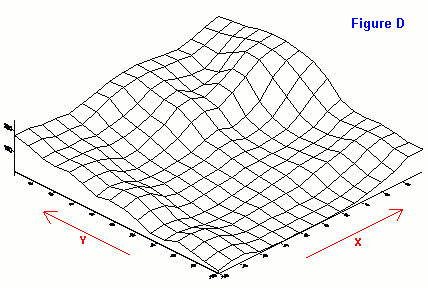 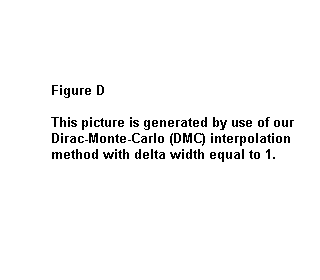 |
We now present the comparison results for the function defined by [Eq. B]. Table C and Table D are for Quality Factor 1 and 2 respectively.
Return to RDIC opening page
© FANG, INC. 2004 All Rights Reserved
 [Eq. B]
 1=
1=


