| Location Number | Input x1 | Input Function f(x1) | Reproduced Function f(x1) with  1=0.2 1=0.2 | Reproduced Function f(x1) with  1=0.5 1=0.5 |
|---|---|---|---|---|
f(x1) = 41.64 + 1.22 x12 + 8.33 x1
where -10. < x1 < +10.
Three quality factors are used for the comparison between our method and two best known interpolation methods (Shepard's method and Hardy's method). They are: Reproduced Function Value, Cross-Validation and Smoothness.
 1 = 0.2 ; (2)
  1 = 0.5. As can be seen, the reproduced function values are in good agreement with the original input data, and case (1) is better than case (2).
| Location Number | Input x1 | Input Function f(x1) | Reproduced Function f(x1) with  1=0.2 1=0.2 | Reproduced Function f(x1) with  1=0.5 1=0.5 |
|---|---|---|---|---|
The table results of cross-validation for our Dirac-Monte-Carlo method shown below are generated by use of the so-called "leave-one-out"scheme.
As can be seen in the above table, both delta width values provide good cross-validation results, except at the end points when x1=-9.99 and 9.
Location
NumberInput x1 Input Function
f(x1)Cross-Validation
Function f(x1)
with  1=0.2
1=0.2Cross-Validation
Function f(x1)
with  1=0.5
1=0.5
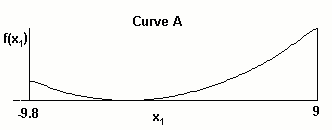
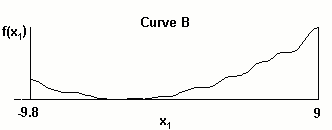
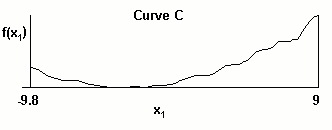
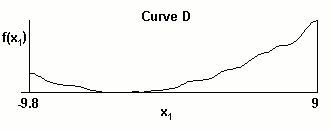
These curves are:


It can be seen that Curve B and C are similar. Curve D is more smooth than Curve B and C. Curve A has the best smoothness. It needs to be said that the larger the delta width value takes in our Dirac-Monte-Carlo method, the more smooth the curve becomes and the less accurate reproduced function the method produces. Thus, it is up to the user to do the trade-off analysis of these quality factors and to set the optimum delta width value. In our future software product, the default value of delta width will be provided for the interpolation calculation.
© FANG, INC. 2004 All Rights Reserved